Innovating Dental Growth
Dental Marketing Analytics
Gumline’s custom-built Analytics Dashboard provides real-time insights into the performance of your dental practice’s website and digital marketing efforts. It’s designed specifically for dental practices, giving you the ability to track and optimize key metrics at every stage.
Understand Your Analytics Dashboard
This comprehensive analytics dashboard provides real-time insights into your website’s performance, advertising efforts, and social media engagement. Leveraging data effectively can significantly improve your understanding of customer behavior, helping you refine strategies and grow your online presence.
Note: The dashboard refreshes every 24 hours, providing up-to-date insights from the previous day and earlier.
Choosing a Time Frame
Your data is displayed on a month-to-month basis. Be sure to select the appropriate month in the center of the dashboard to view the relevant data.
Dashboard Preview:
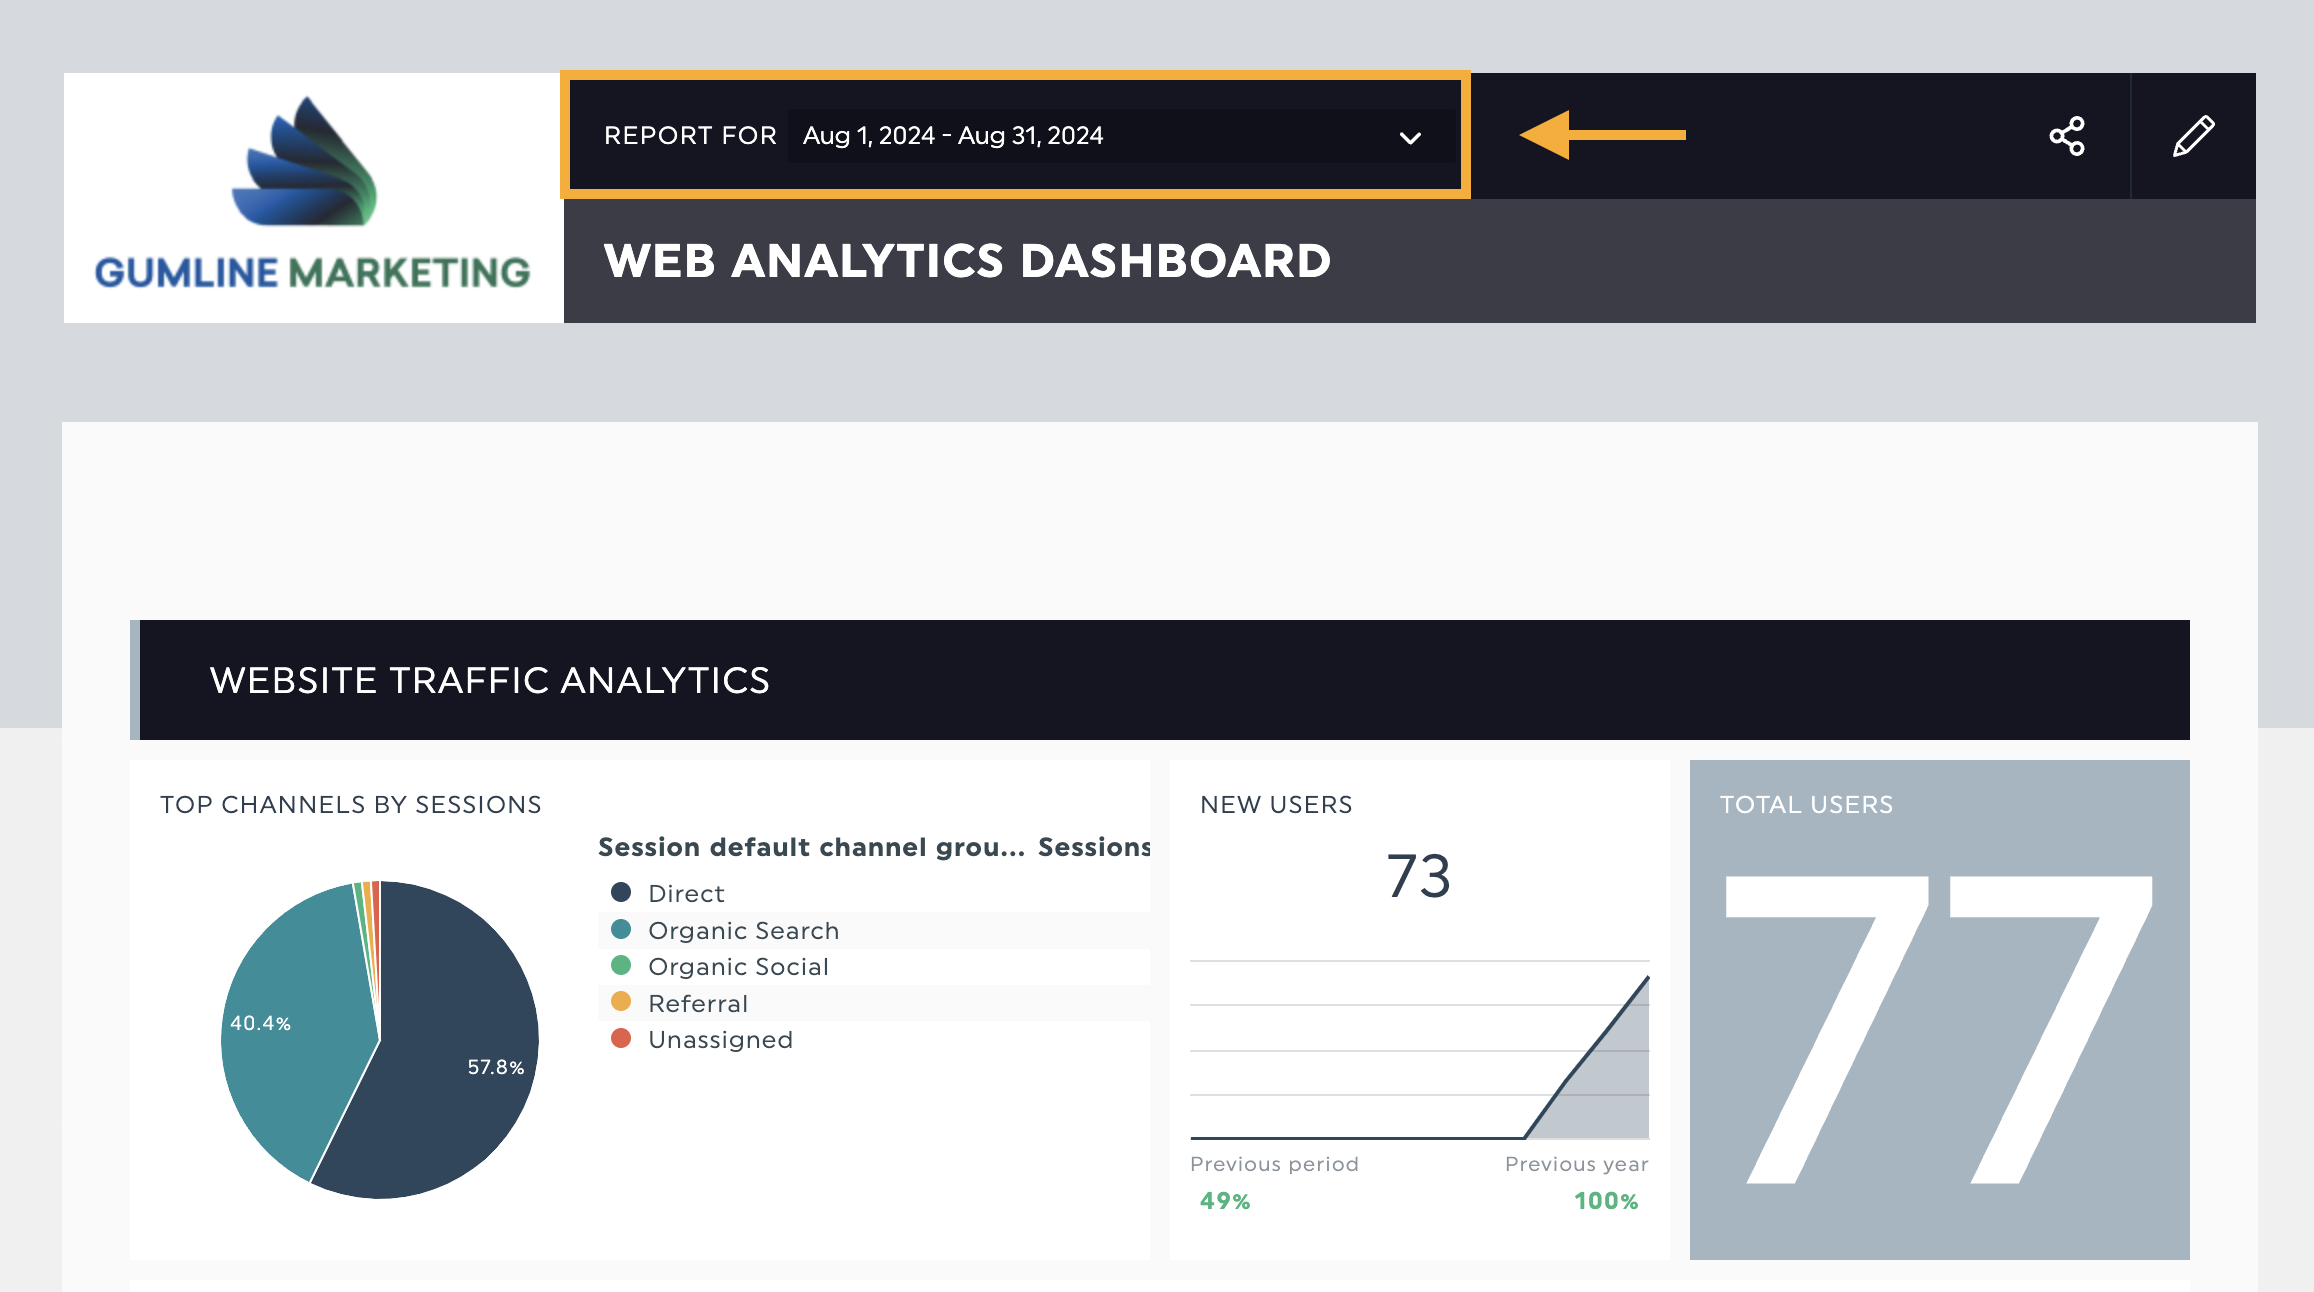
Website Traffic Analytics
This section provides in-depth insights into your website’s traffic, helping you understand where your visitors are coming from and how they interact with your site. By analyzing these metrics, you can optimize your marketing strategies and enhance user engagement to drive growth.
- Top Channels by Session: Identify which channels (e.g., organic search, direct traffic, social media, referrals) are bringing the most visitors to your website. Understanding these traffic sources will help you focus on the most effective marketing efforts.
- New Users: Displays the number of first-time visitors to your site, giving you insight into how well your website is attracting new potential customers.
- Total Users: The overall number of unique visitors who have interacted with your website during the selected time frame. This metric counts each user only once, regardless of how many times they visit.
- Top Converting Pages (Page Path + Query String and Screen Class): Highlights the pages on your site that are most successful at converting visitors into leads, appointments, or other desired actions. Each page’s URL and additional parameters give further context on where the conversions are happening.
- Sessions from Organic: Tracks the number of sessions driven by organic search, offering insights into the effectiveness of your SEO strategy in bringing new visitors to your site.
- Bounce Rate: Measures the percentage of visitors who leave your site after viewing only one page. A high bounce rate may indicate a need to improve the relevancy or engagement of your landing pages.
- Top Traffic Sources: Shows which platforms or sources (e.g., search engines, social media, referral sites) are driving the most traffic to your site. This data helps refine marketing strategies by focusing on high-performing sources.
- Top Sessions by City: Provides a breakdown of which cities are generating the most website sessions, offering insights into your geographical reach and helping tailor content or campaigns to specific regions.
- Percentage of New Users (% New Users): Displays the proportion of total users who are visiting your site for the first time. A higher percentage of new users can be a good indicator of successful marketing efforts aimed at reaching new audiences.
Dashboard Preview:

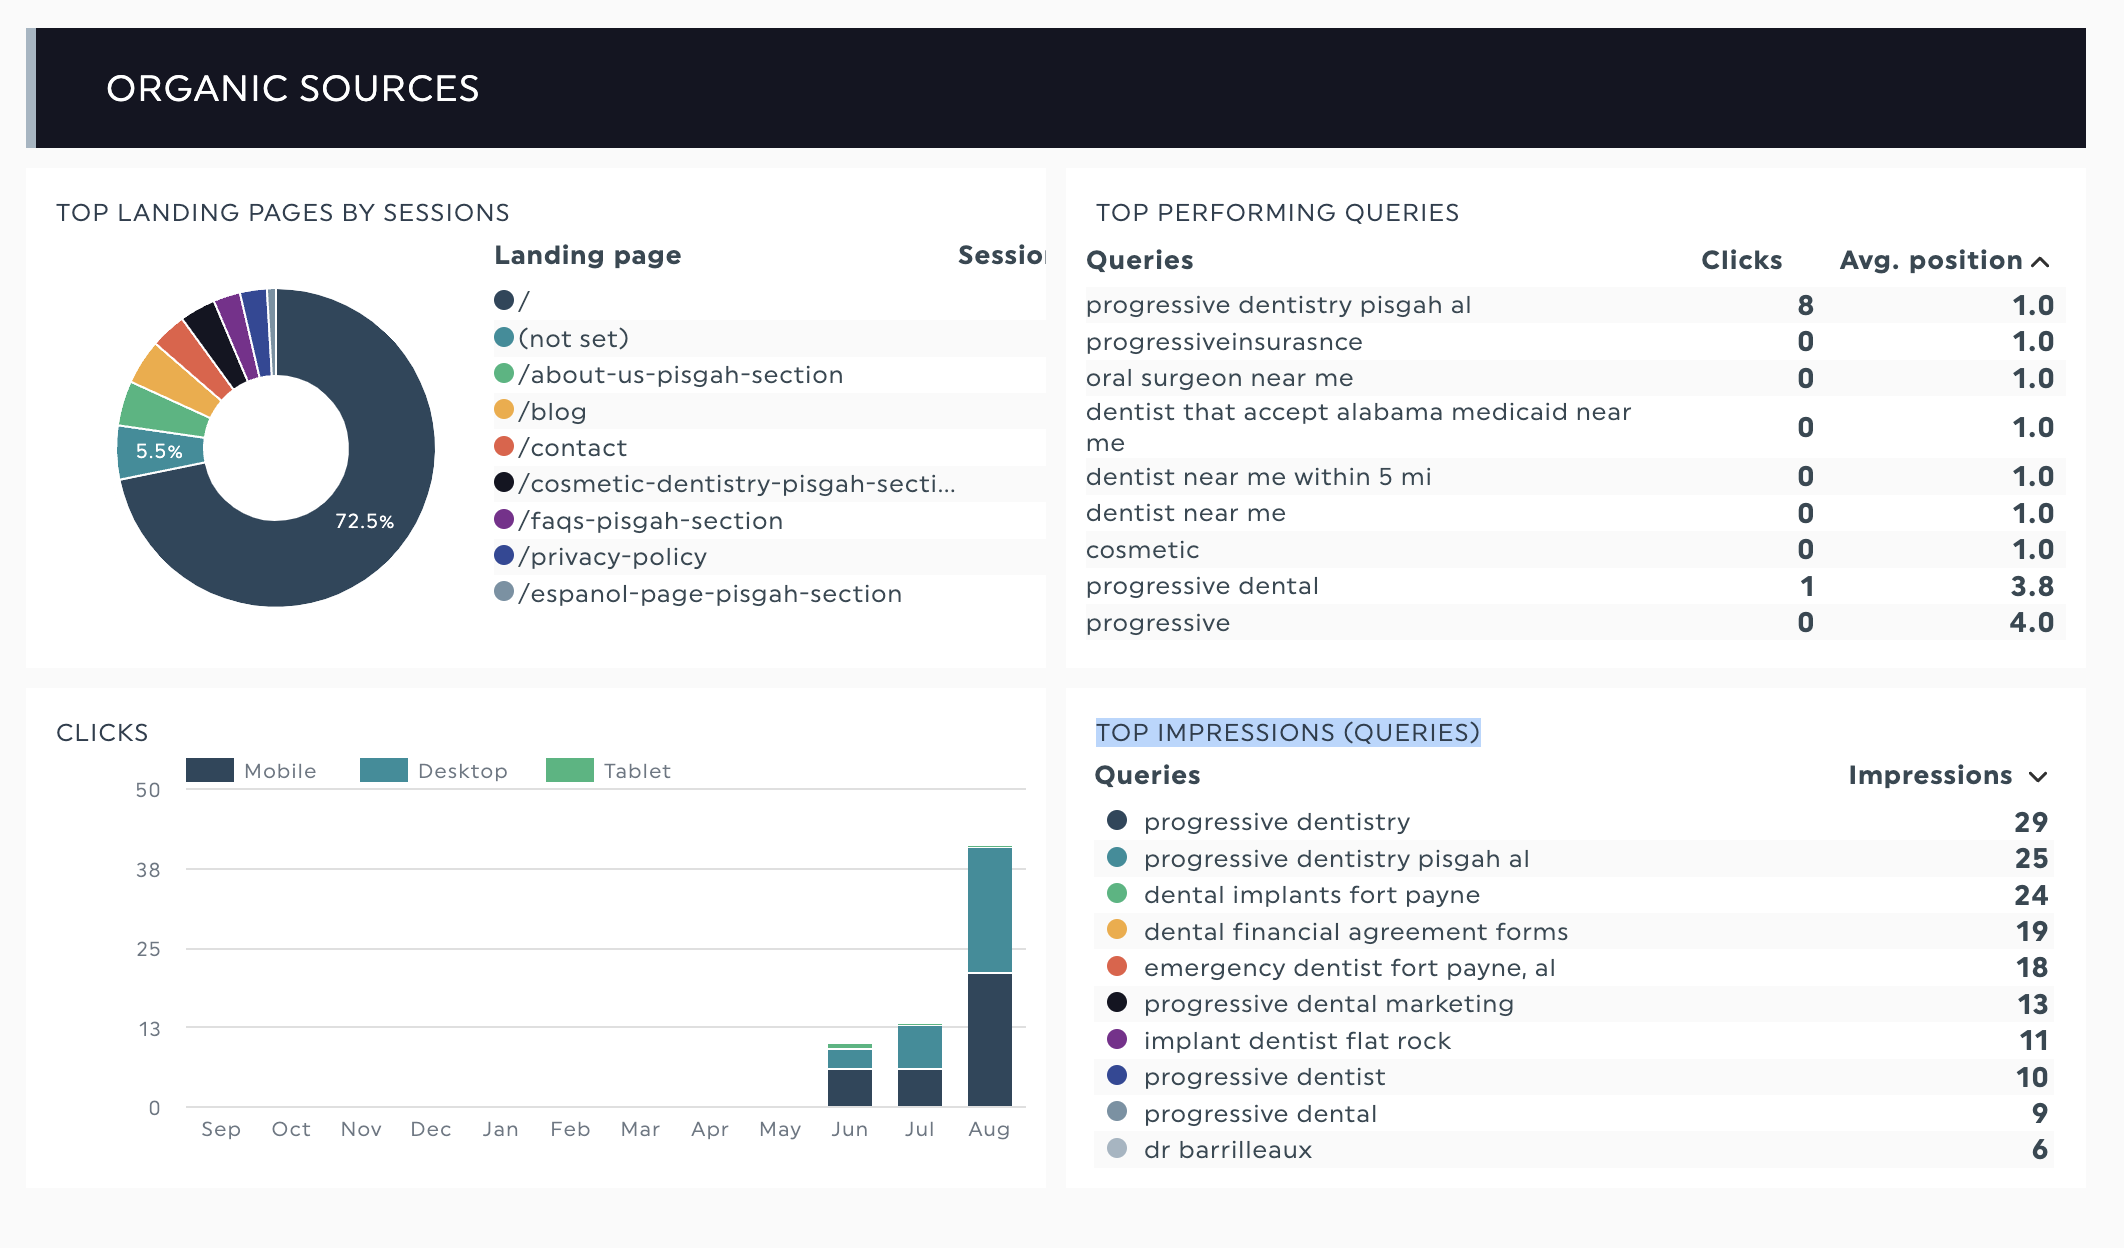
Organic Website Sources
This section focuses on the performance of your website in organic search, providing valuable insights into how well your content attracts and engages users from search engines. By analyzing these metrics, you can better understand user behavior and optimize your SEO strategies.
- Top Landing Pages by Sessions: This metric highlights the most visited landing pages that attract traffic from organic search. Understanding which pages drive the most sessions helps you identify high-performing content and opportunities for further optimization.
- Clicks by Device (Mobile, Desktop, Tablet): Breaks down the total number of clicks your site receives from different devices. This data allows you to assess how users are interacting with your site based on the device they’re using, and optimize for mobile, desktop, or tablet experiences accordingly.
- Top Performing Queries (Clicks and Average Position): Displays the search queries that generate the most clicks to your site, along with their average ranking position in search results. This information is crucial for assessing which keywords are driving traffic and determining your visibility in search engine results pages (SERPs).
- Top Impressions (Queries): Shows the queries for which your website appears in search results, ranked by the number of times they are seen (impressions). Tracking top impressions helps you understand which keywords are getting your site noticed, even if they haven’t yet converted into clicks.
Dashboard Preview:
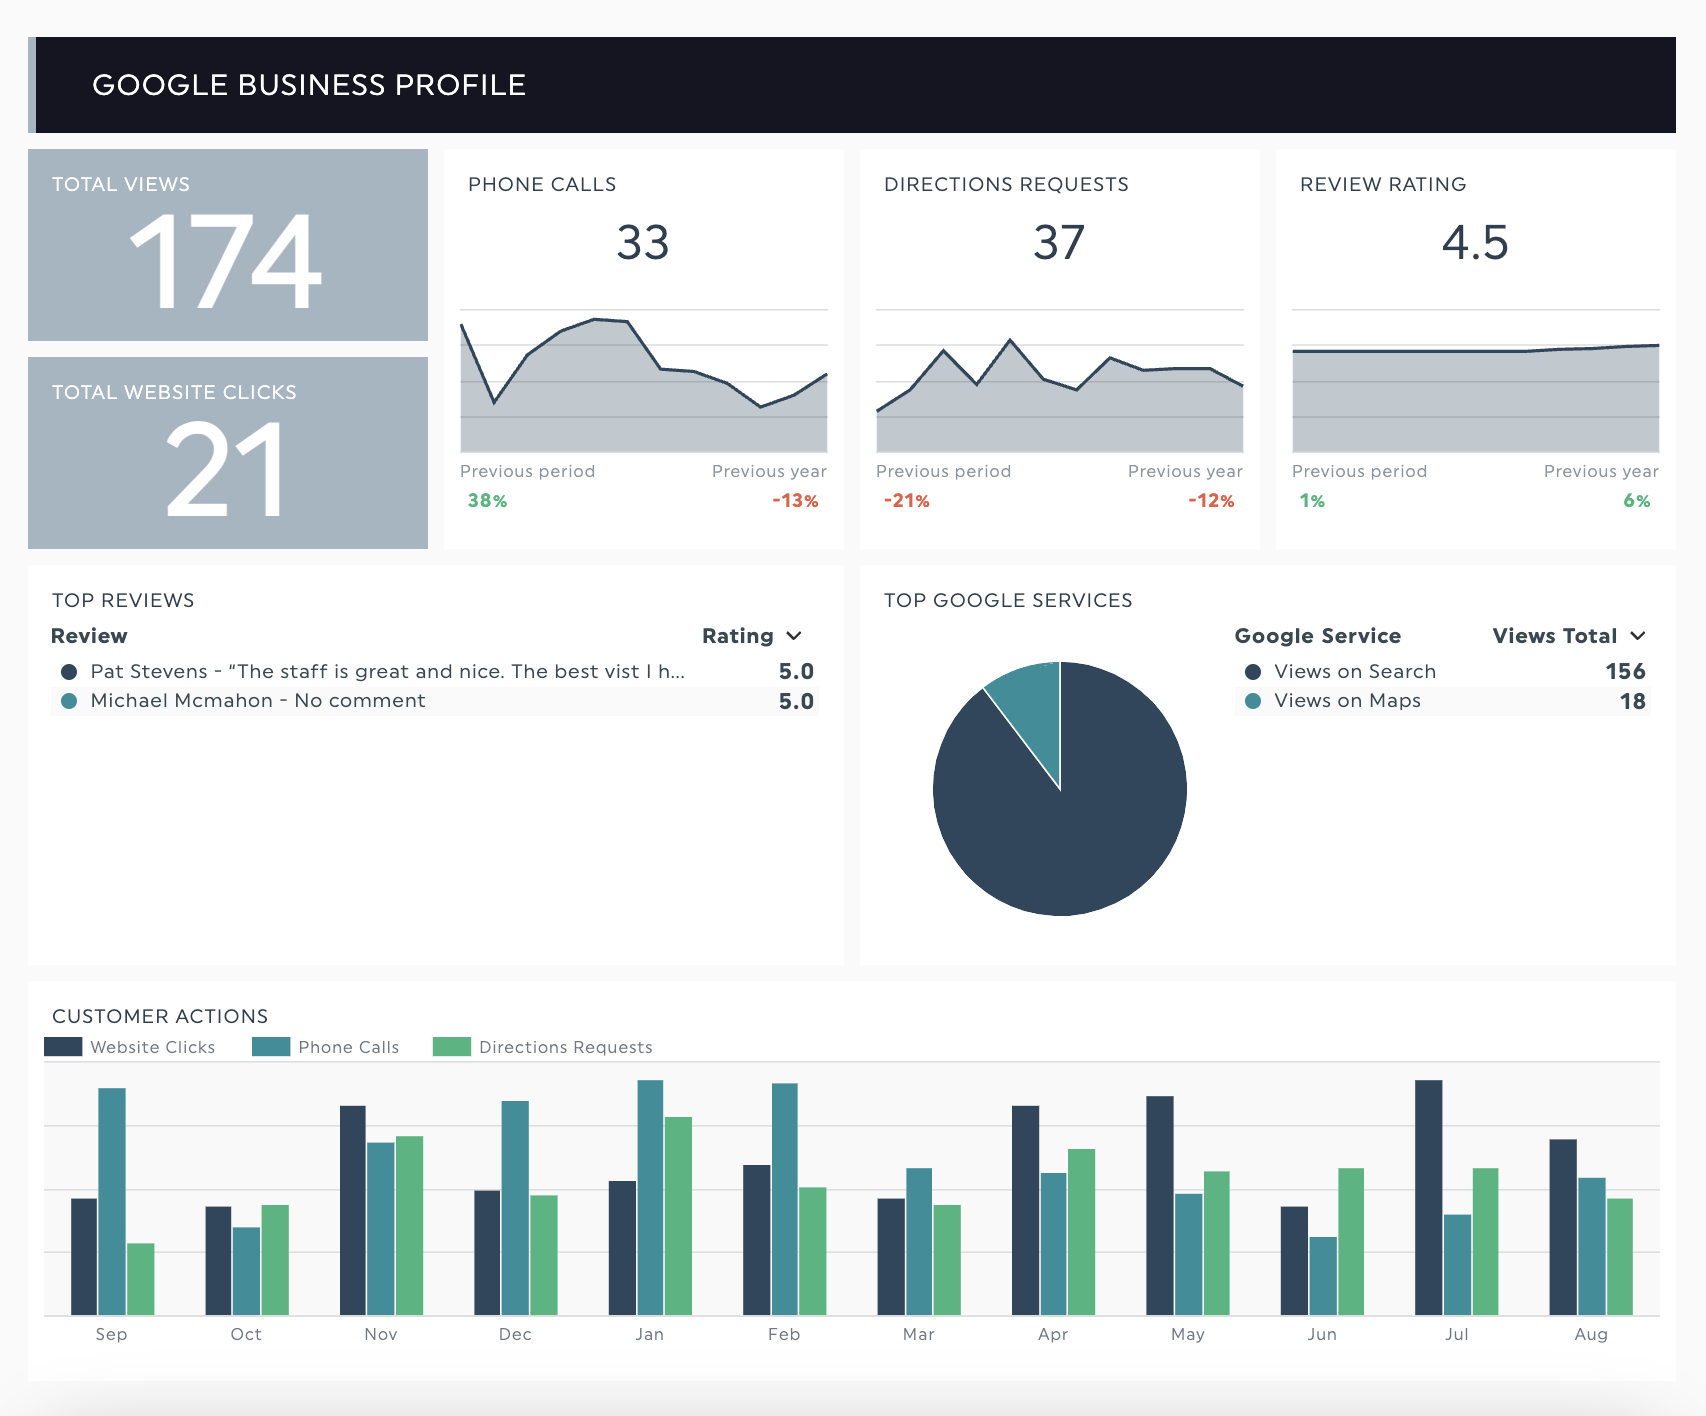
Google Business Profile Analytics
This section provides an overview of your Google Business Profile (GBP) performance, offering insights into how potential patients are interacting with your profile. These metrics help you evaluate your local search visibility and how effectively your profile is driving engagement with your practice.
- Total Views: Displays the total number of times your Google Business Profile has been viewed by users. This includes both searches and map views, offering a snapshot of your visibility in local search results.
- Total Website Clicks: Tracks the number of times users clicked through to your website directly from your Google Business Profile. This metric helps you measure how effectively your profile is driving traffic to your site.
- Phone Calls: Shows the total number of phone calls initiated from your profile. This is a key metric for tracking direct engagement from potential patients seeking immediate contact with your practice.
- Directions Requests: Displays the number of users who requested directions to your practice location via your profile. This indicates how many potential patients are using your profile to visit your physical location.
- Review Rating: Provides the average rating of your practice based on user reviews. A higher rating can significantly impact the perception of your practice and encourage more users to engage with your services.
- Top Reviews: Highlights the most prominent reviews of your practice, giving you insight into what patients are saying about their experiences. Positive reviews can build trust, while addressing negative feedback can improve your reputation.
- Top Google Services: Displays the most popular services listed on your Google Business Profile that users are engaging with. This helps you understand which services attract the most attention and may need further promotion.
- Customer Actions: Breaks down the key actions users are taking from your profile:
- Website Clicks: Tracks how many users clicked to visit your website.
- Phone Calls: Measures the number of calls initiated through your profile.
- Directions Requests: Counts how many users requested directions to your location.
Dashboard Preview:
Google Adwords (PPC) Analytics
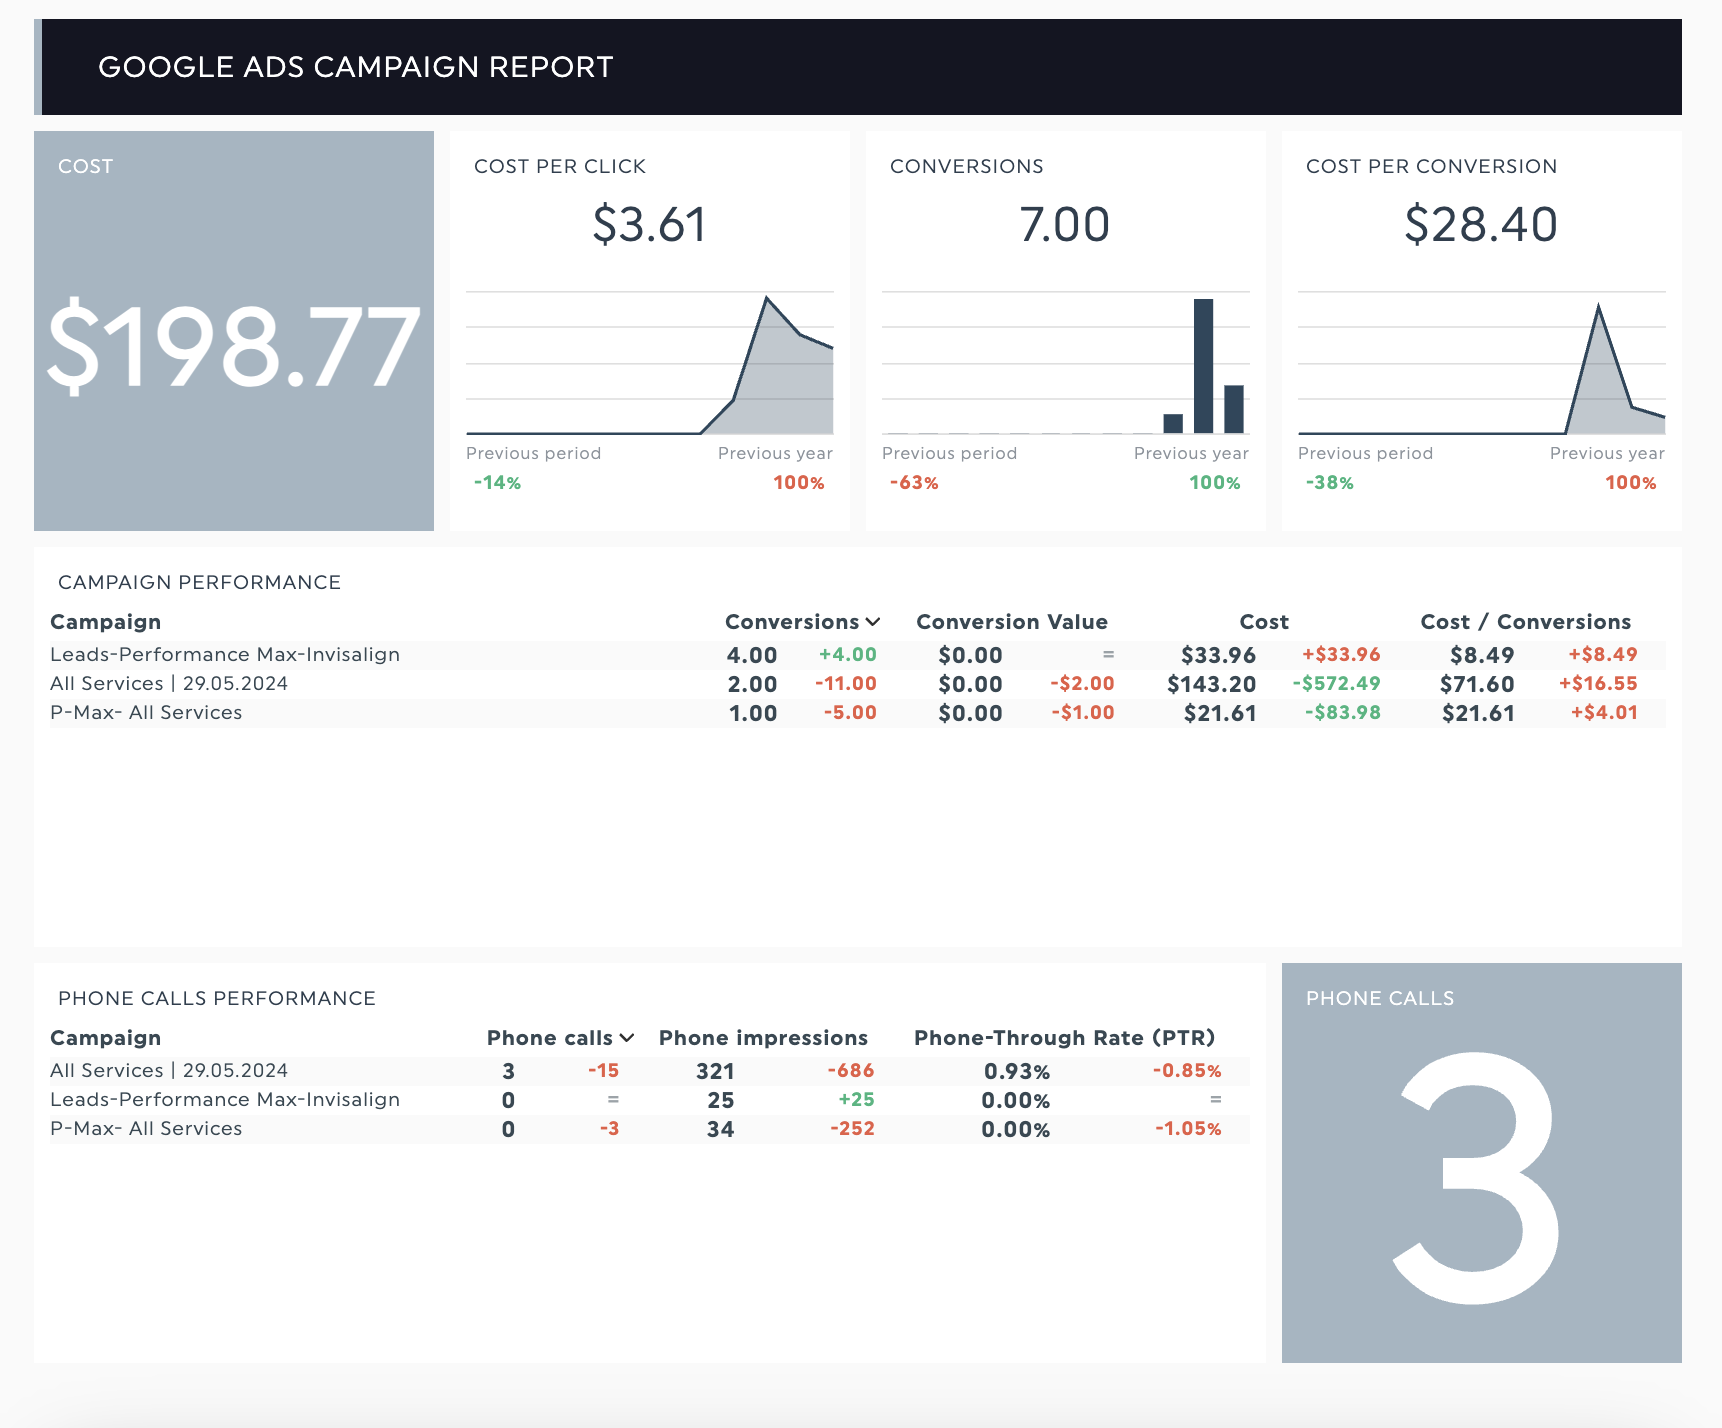
Google Ads Campaign Report
This section provides a detailed overview of your Google Ads campaign performance, helping you track key metrics and optimize your ad spend. By analyzing these insights, you can assess the effectiveness of your campaigns in driving traffic and conversions for your dental practice.
- Cost: The total amount spent on your Google Ads campaigns during the selected time period. This metric helps you manage your budget and assess the return on investment (ROI) for each campaign.
- Cost Per Click (CPC): The average amount you’re paying for each click on your ads. CPC helps you measure the efficiency of your ad spend in relation to the traffic it generates.
- Conversions: The total number of desired actions (such as form submissions, bookings, or calls) generated by your ads. This is a key indicator of how well your campaigns are turning clicks into valuable actions.
- Cost Per Conversion: The average amount spent to acquire each conversion. A lower cost per conversion means your campaigns are generating high-value actions more efficiently.
Campaign Performance: This breakdown provides detailed performance data for each campaign, including:
- Campaign Name: The name of the campaign.
- Conversions: The total number of conversions generated by the campaign.
- Conversion Value: The estimated value generated from conversions.
- Cost: The total spend for the campaign.
- Cost/Conversions: The cost required to generate each conversion, allowing you to optimize your budget.
Phone Calls Performance: Tracks the effectiveness of your ads in generating phone calls, with detailed data on:
- Campaign Name: The name of the campaign.
- Phone Calls: The number of phone calls initiated through your ads.
- Phone Impressions: The number of times your phone call button was shown to users.
- Phone Through Rate (PTR): The percentage of phone impressions that resulted in a call, indicating the effectiveness of your ads in driving phone engagement.
Dashboard Preview:
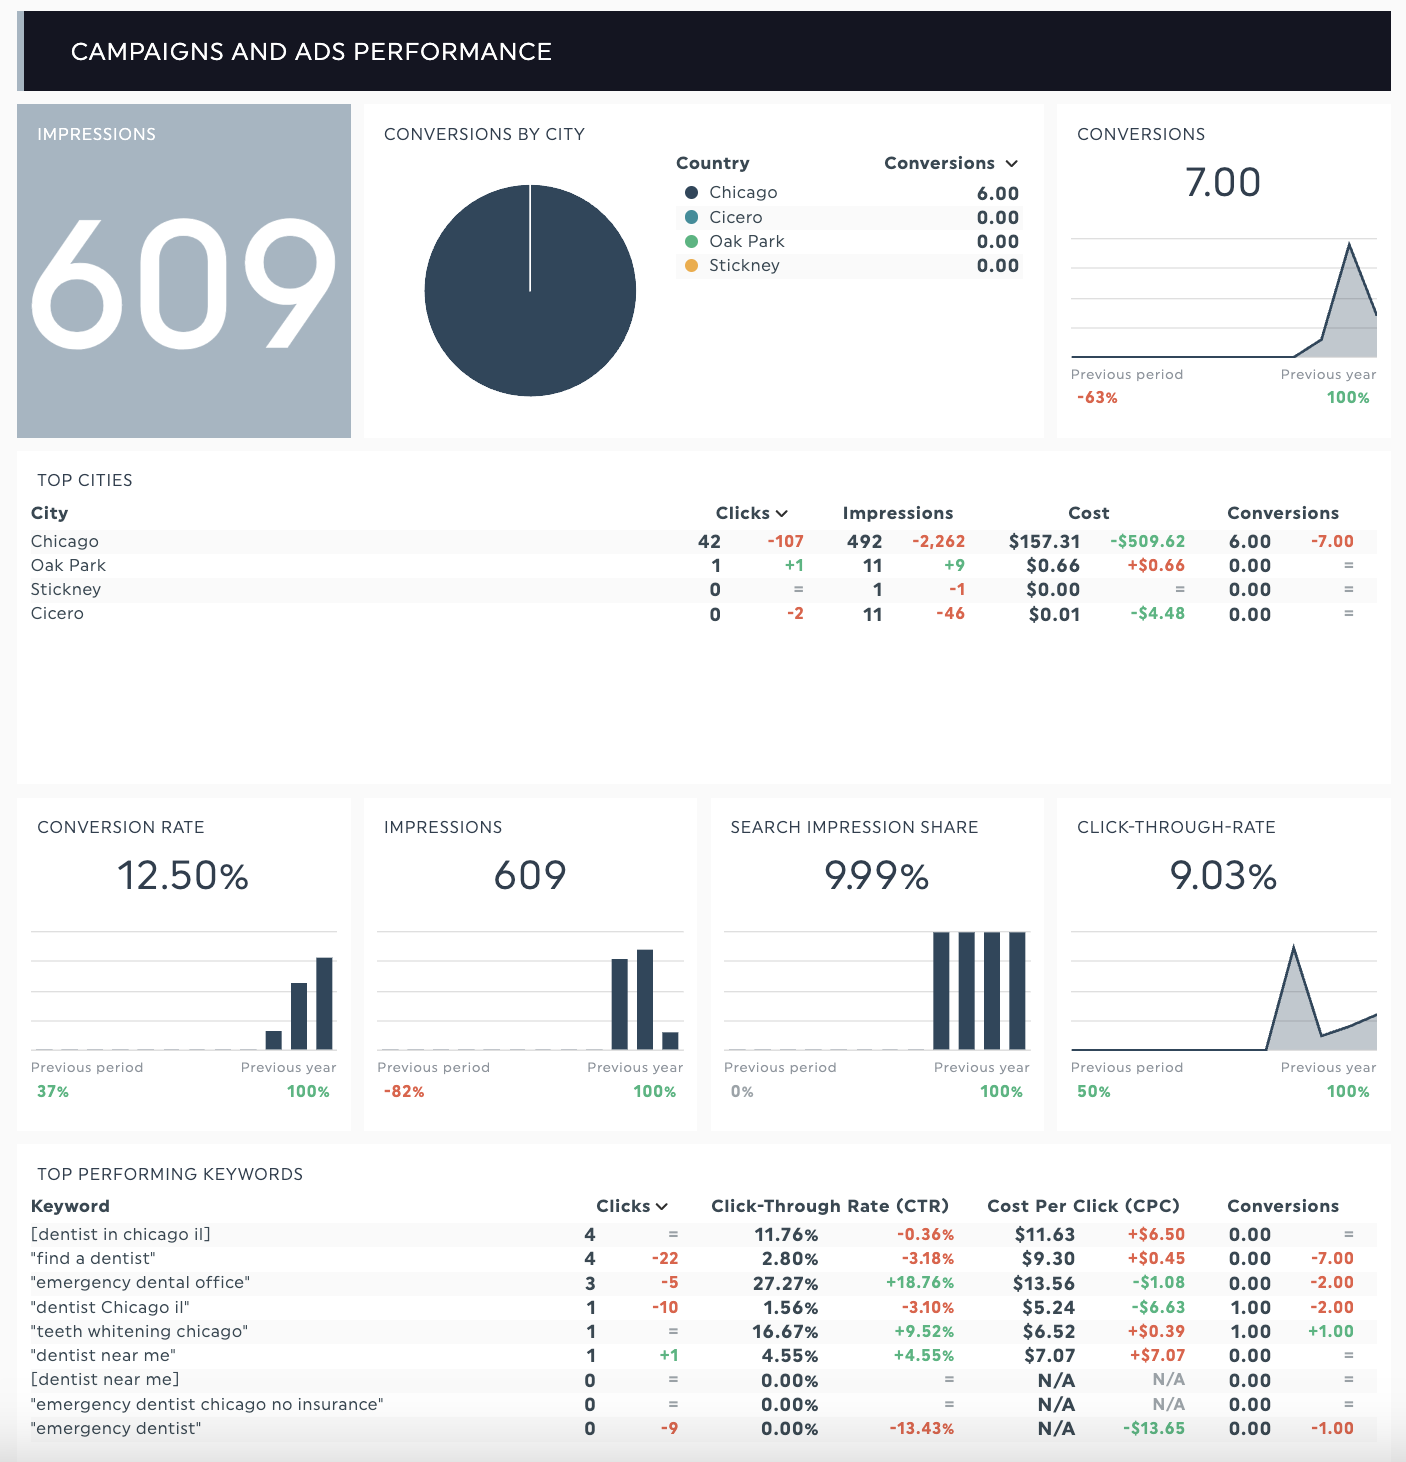
Campaigns and Ads Performance
This section provides a comprehensive overview of your Google Ads campaigns and their performance across various metrics, helping you identify successful strategies and optimize underperforming areas. By analyzing these insights, you can drive more conversions and improve the overall effectiveness of your marketing efforts.
- Impressions: The total number of times your ads were shown to users. This metric helps you understand the visibility of your ads and their potential reach in search results or display networks.
- Conversions by City: Shows the number of conversions segmented by city, helping you assess which locations are generating the most valuable actions and providing insights for geographic targeting.
- Conversions: The total number of completed actions, such as form submissions or phone calls, generated by your campaigns. This is a key indicator of how well your ads are achieving their objectives.
- Conversion Rate: The percentage of clicks that resulted in a conversion, giving you an indication of how well your ads are turning visitors into leads or customers.
- Search Impression Share: The percentage of impressions your ads received compared to the total number of impressions they were eligible for. This helps you understand how visible your ads are in relation to your competition.
- Click-Through-Rate (CTR): The percentage of users who clicked on your ads after seeing them. A higher CTR indicates that your ad content is engaging and relevant to your audience.
Top Cities: A breakdown of the highest-performing cities for your campaigns, including:
- City: The location generating traffic and conversions.
- Clicks: The number of clicks your ads received in each city.
- Impressions: The number of times your ads were displayed in each city.
- Cost: The total amount spent on ads targeting each city.
- Conversions: The number of conversions generated in each location.
Top Performing Keywords: A breakdown of the keywords driving the most traffic and conversions, including:
- Clicks: The number of clicks each keyword generated.
- Click-Through Rate (CTR): The percentage of impressions that resulted in clicks for each keyword.
- Cost Per Click (CPC): The average amount paid per click for each keyword.
- Conversions: The total number of conversions attributed to each keyword, helping you identify which terms are driving the most valuable actions.
Dashboard Preview: